
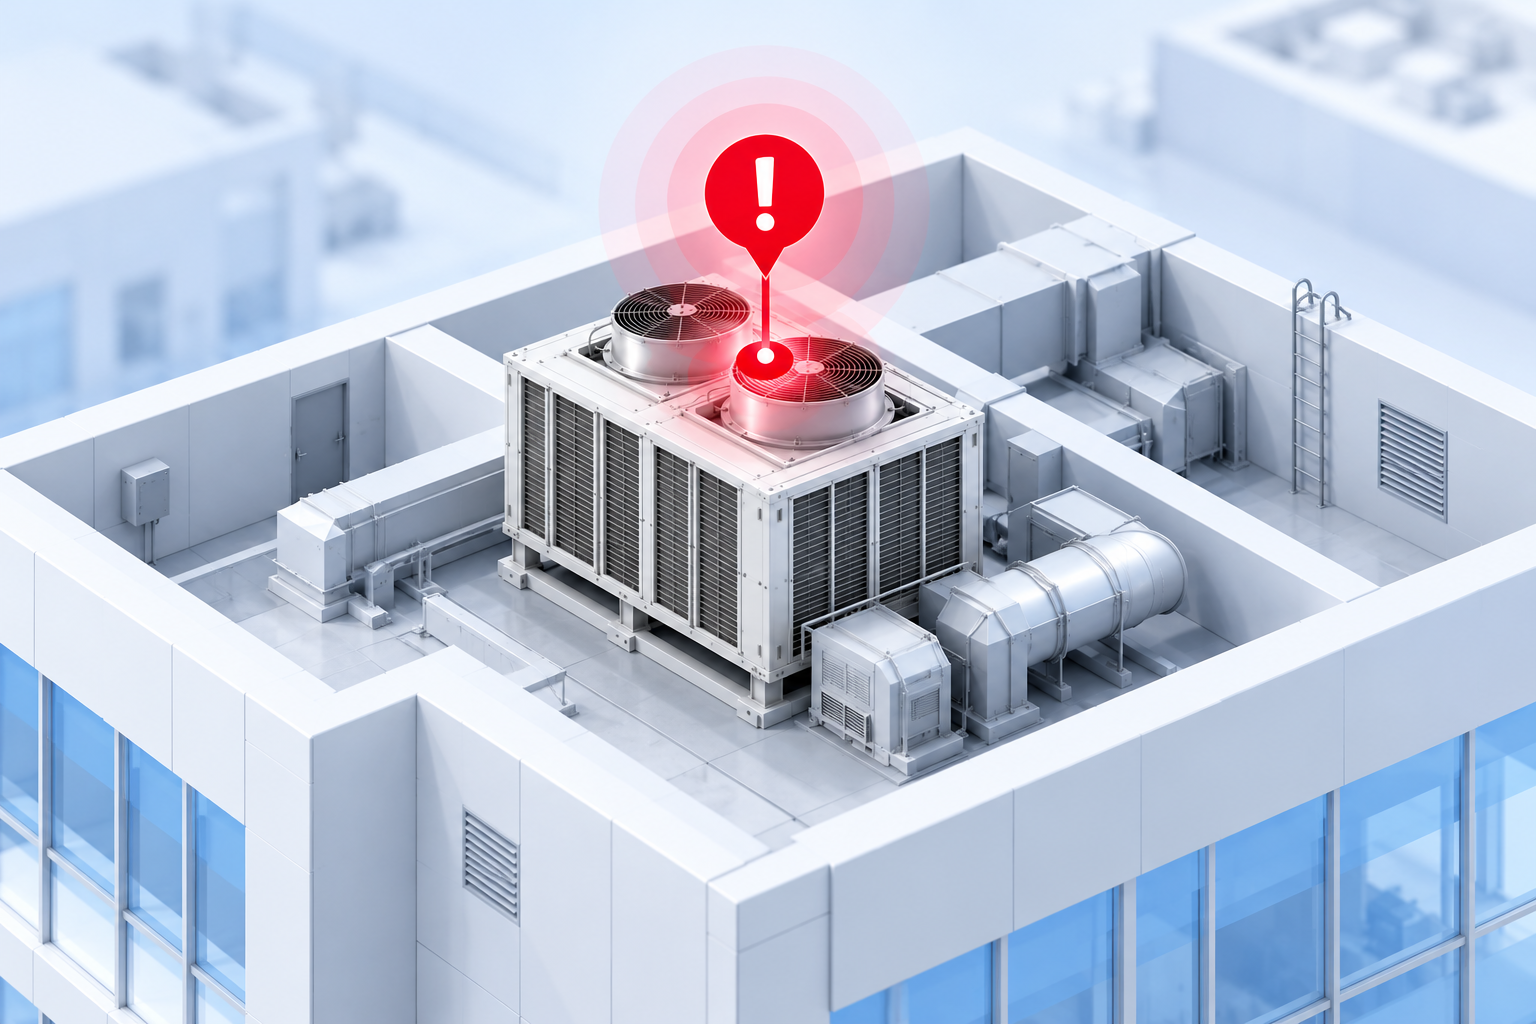

Alarm Insights
Detect and prioritize HVAC faults before they impact operations.
- !High Supply Air Temperature2 min ago
- !Low CHW Pressure18 min ago
- !AHU Fan Failure1 hr ago
- !Filter Pressure High3 hr ago
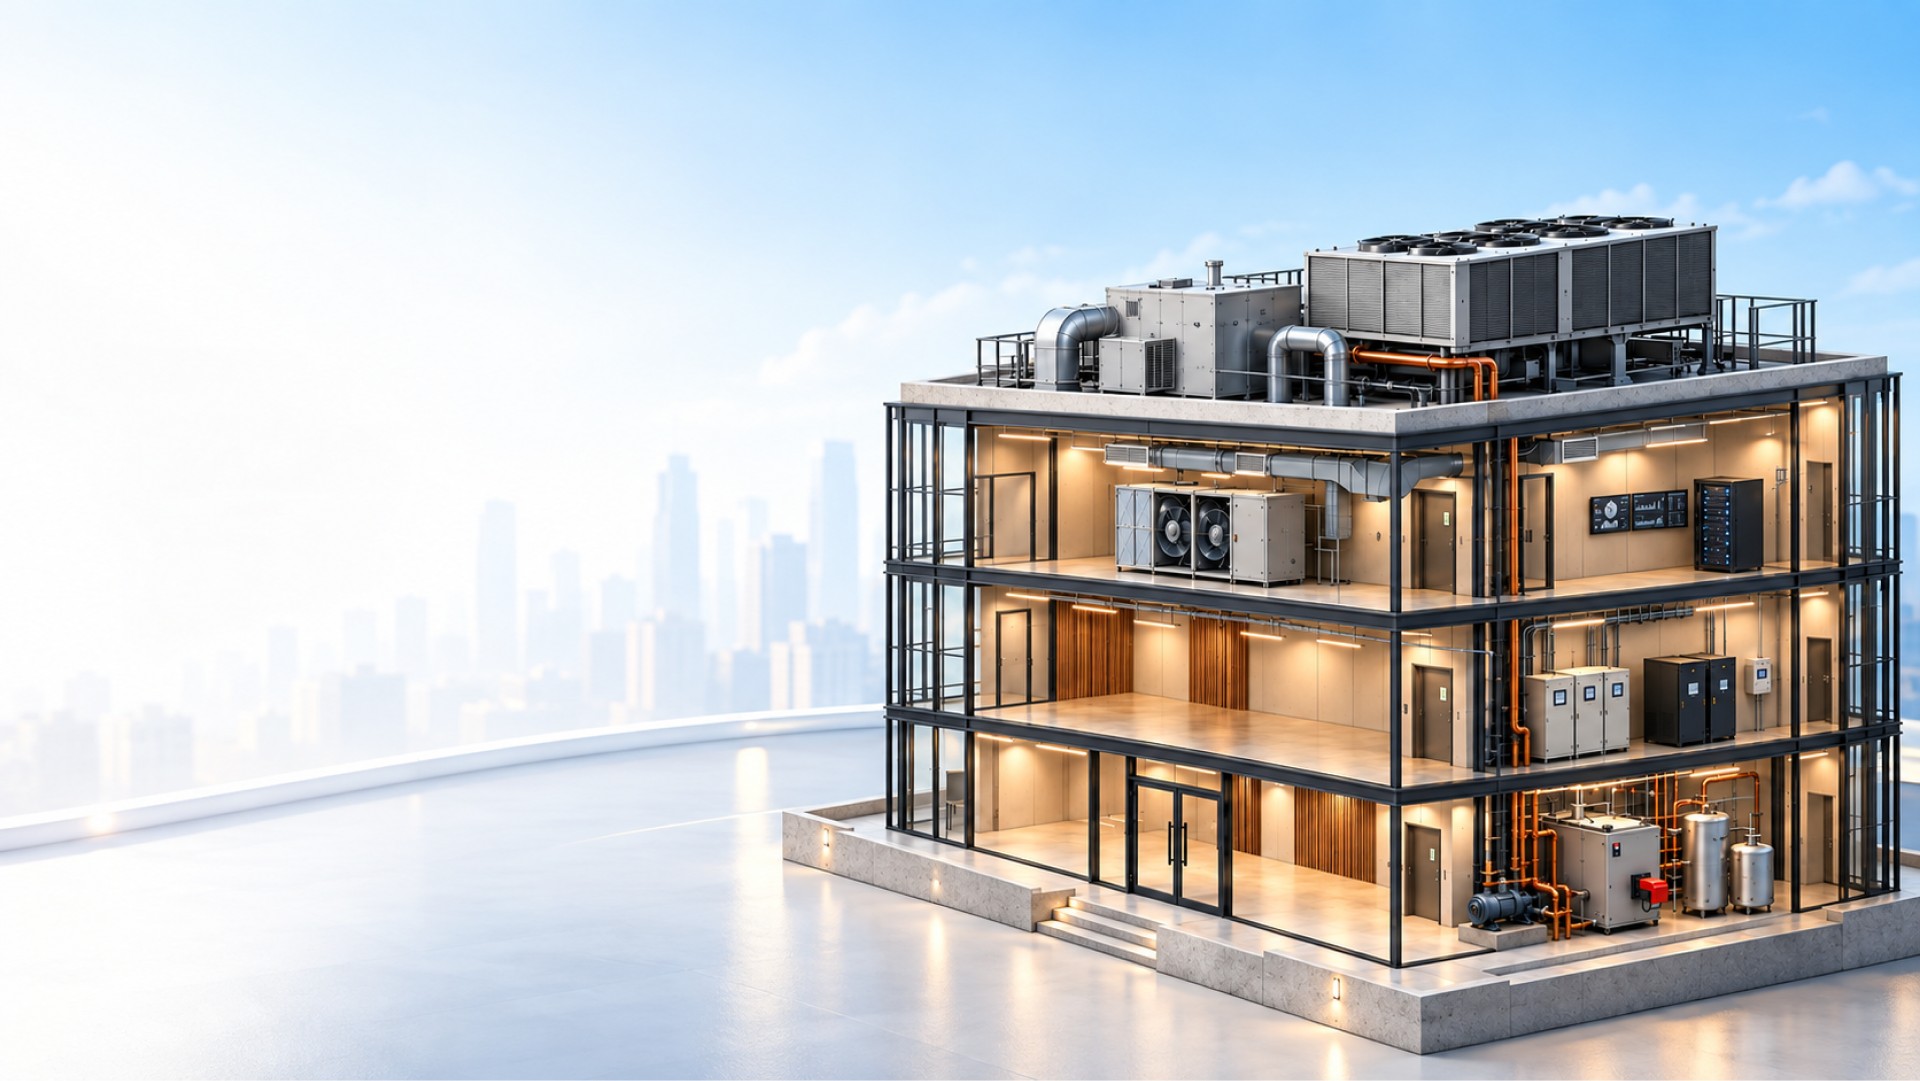
HVAC intelligence for every building
Energy Waste Adds Up Before Equipment Breaks Down. Otymize Helps You Spot Hidden HVAC Faults, Prioritize The Alarms That Matter, And Verify That Every Fix Worked.
How Otymize works
Otymize Collects, Analyzes, And Visualizes Your Building's HVAC Data So You Can Spot Issues Early, Optimize Performance, And Take Confident Action.
 1. CollectBring all your HVAC data into one place.2. AnalyzeTurn data into clear, actionable insights.3. ActPrioritize fixes and improve performance.

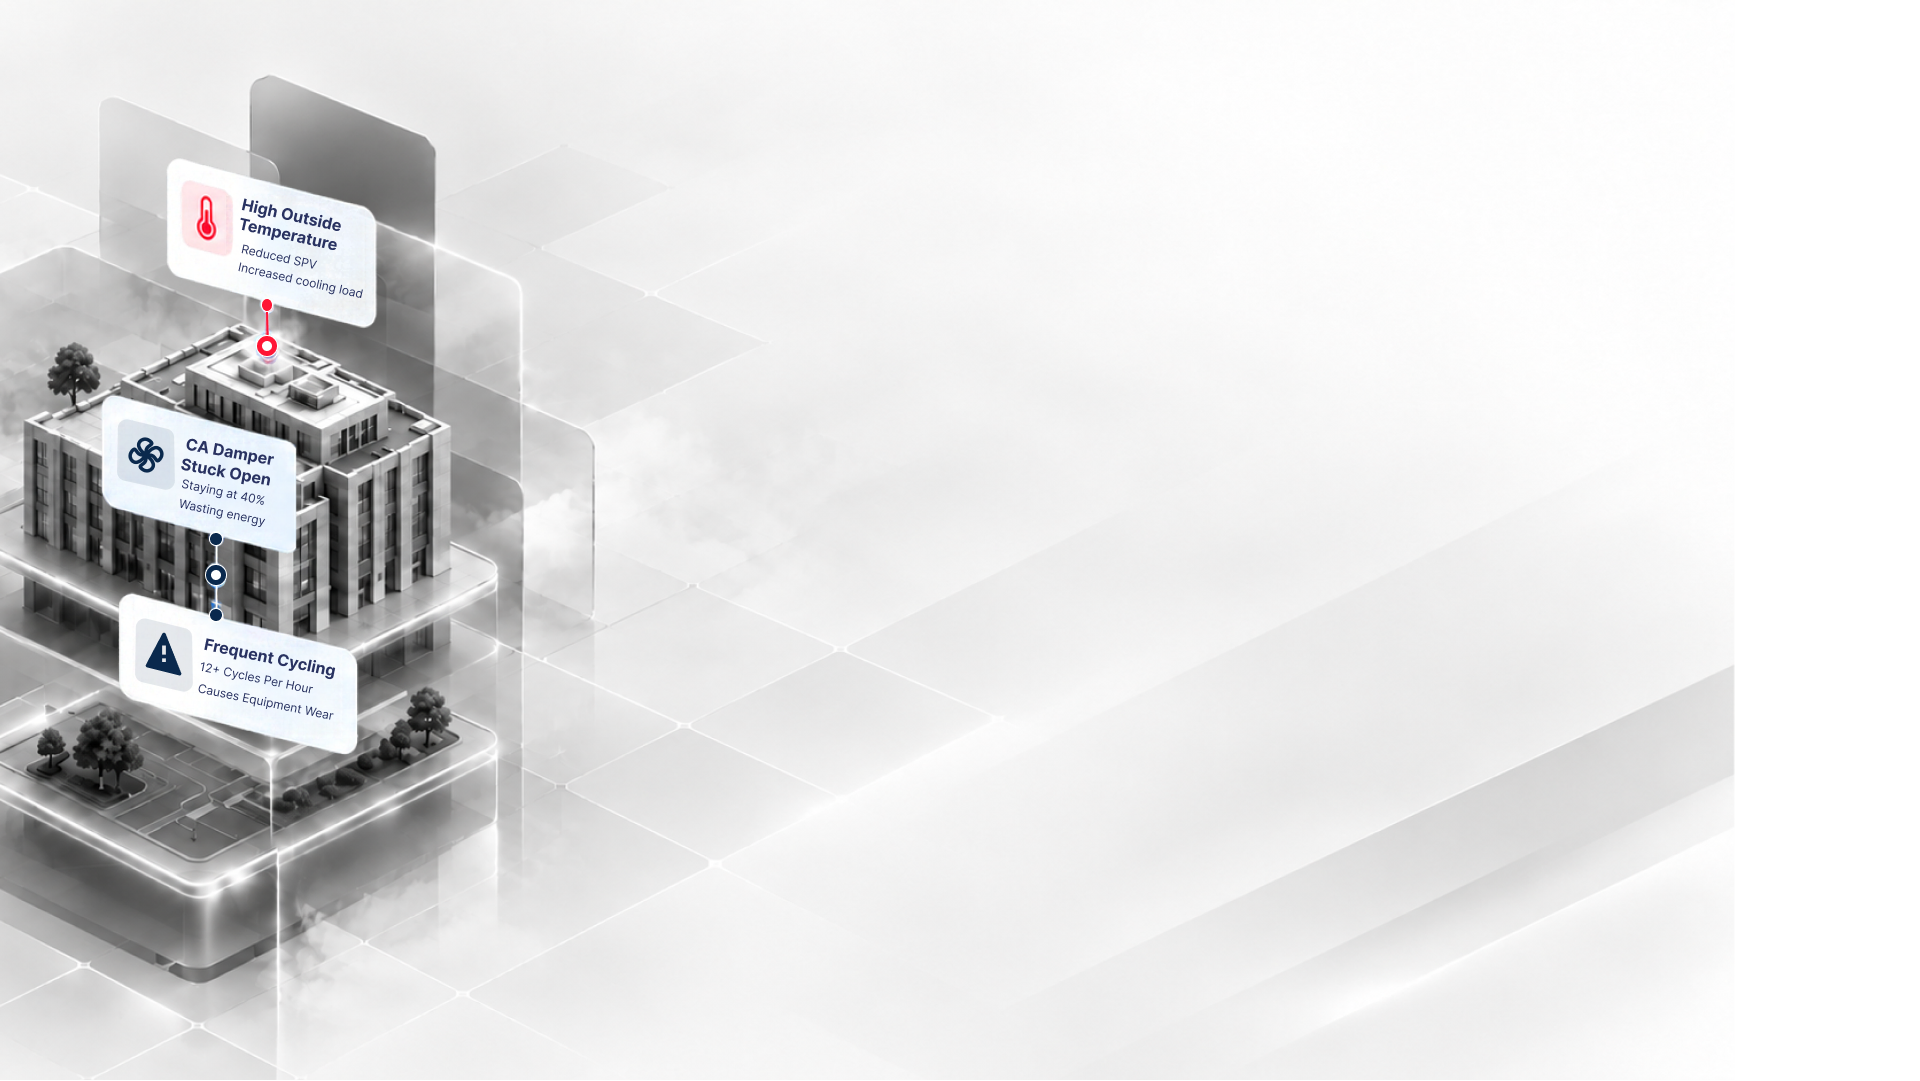
HVAC Analytics
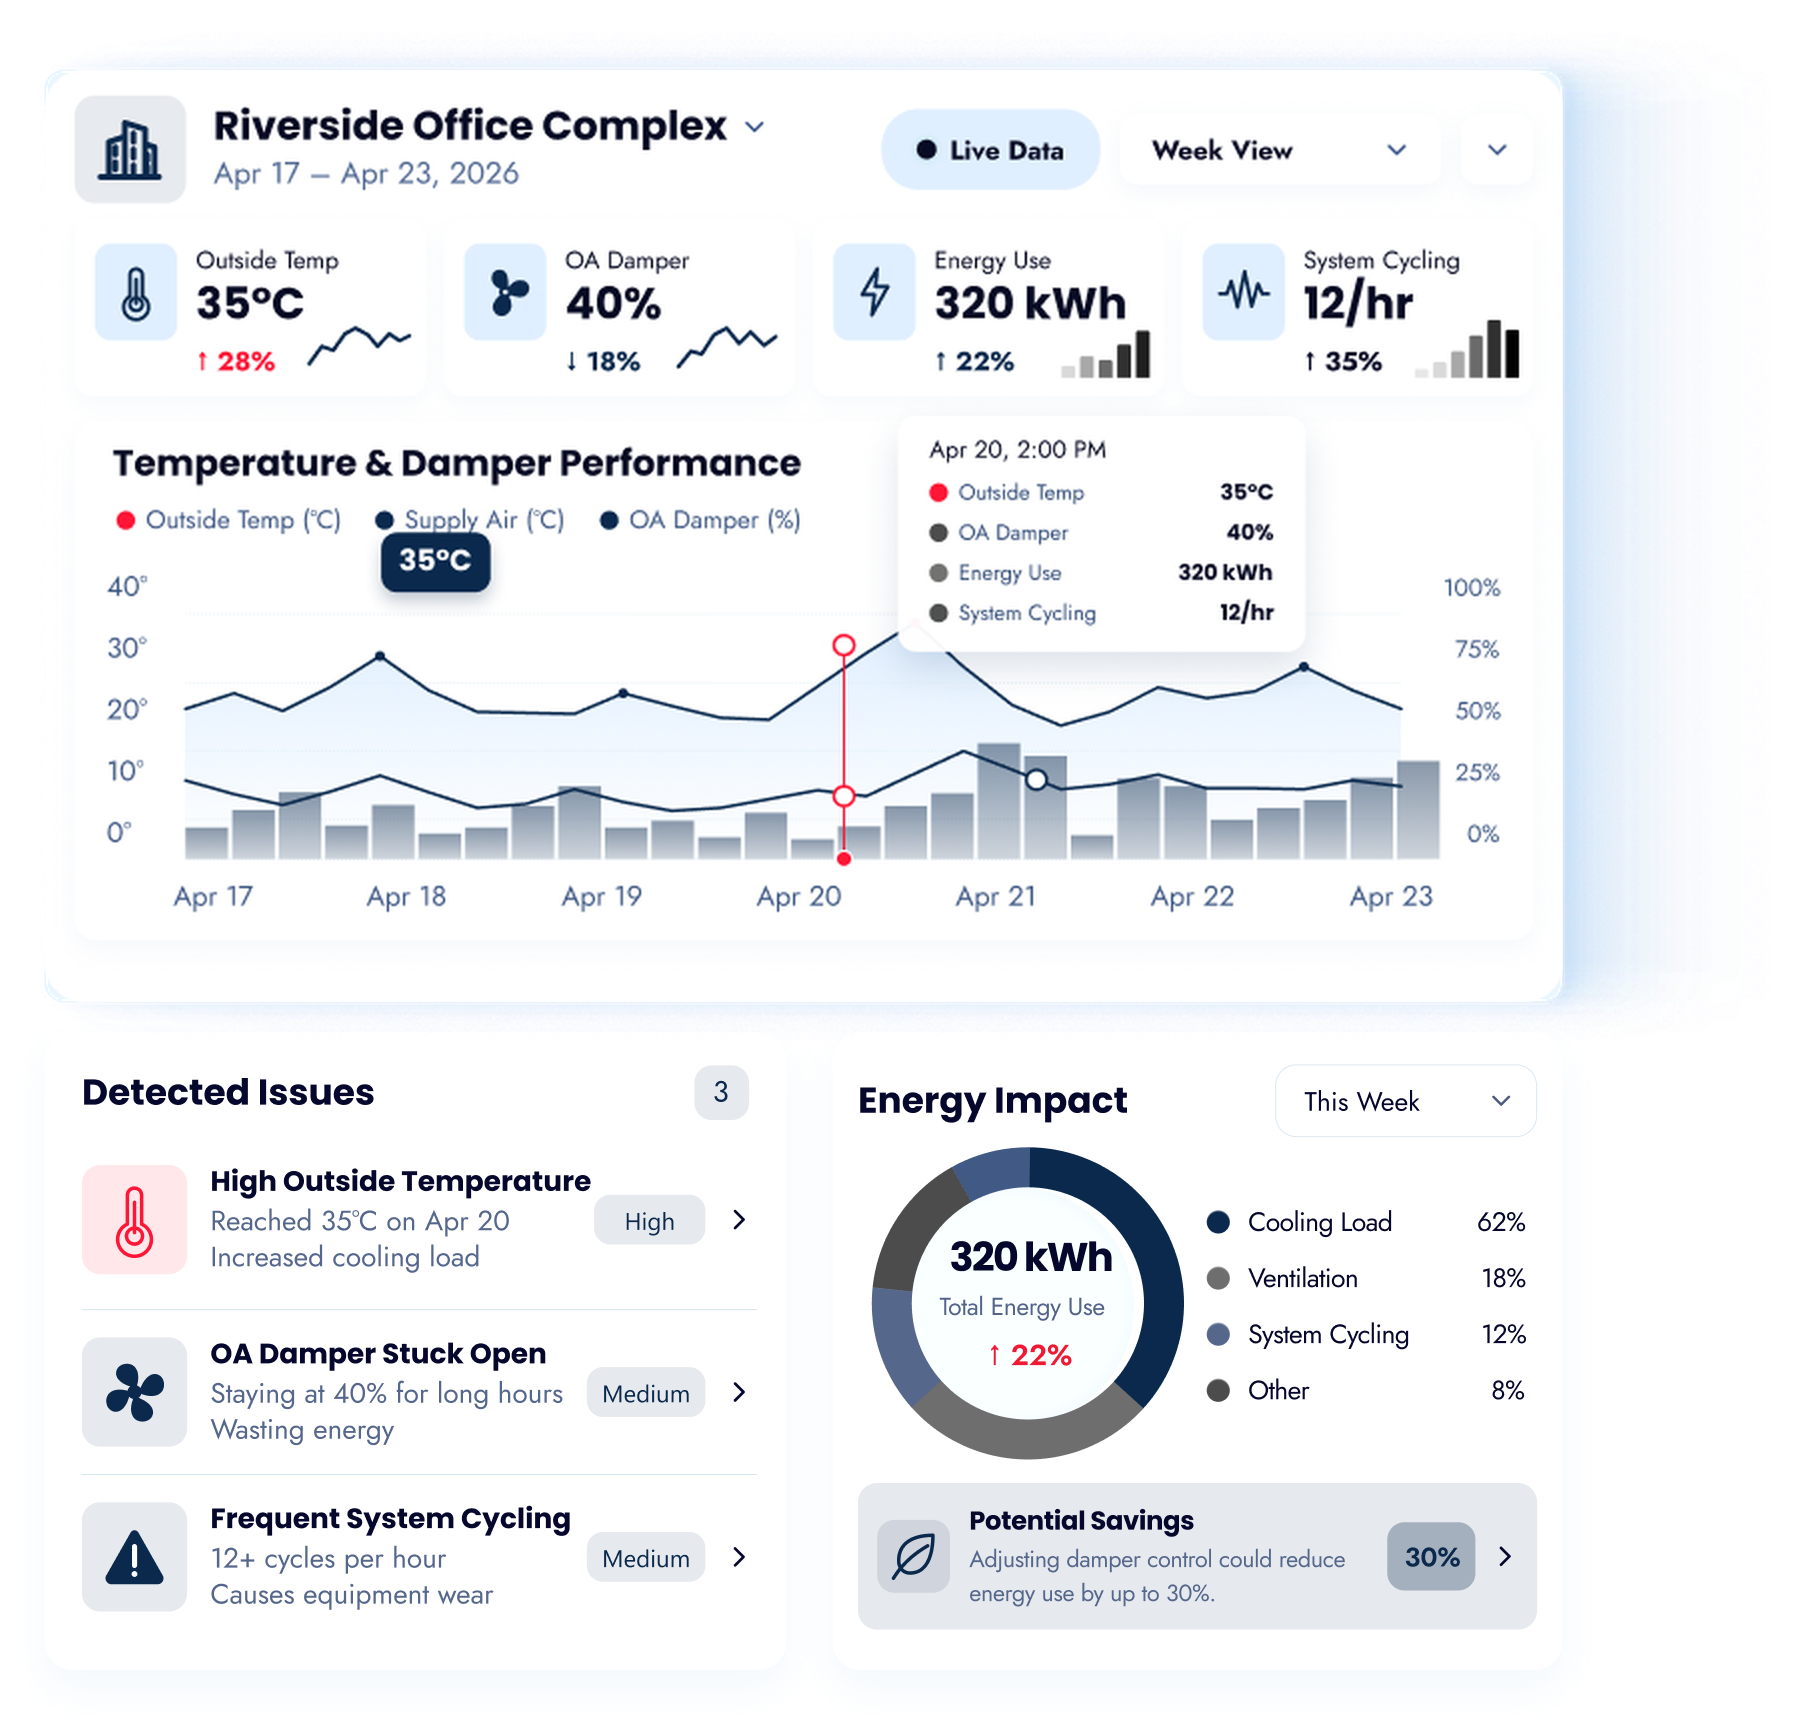
Otymize Reads Real Time Data From Your Air Handlers, Chillers
And Boilers, Detects The Faults That Waste Energy, And Shows
You Which Alarms Matter So Your Team Can Fix Issues Faster
And Keep Every Building Running At Its Best.
 Data Driven DecisionsTurn complex HVAC data into clear, actionable insights.
 Lower Operating CostsIdentify energy waste and unnecessary maintenance.
 More Reliable PerformanceDetect issues early and prevent costly downtime.


Built for smarter operations
Everything you need to spot issues, reduce waste, and keep buildings running at their best.
Detect and prioritize HVAC faults before they impact operations.
Visualize energy consumption and find opportunities to save.
Energy Use
320 kWh ↓ 12%
vs. previous period
kWh ▾Monitor equipment performance and health in real time.
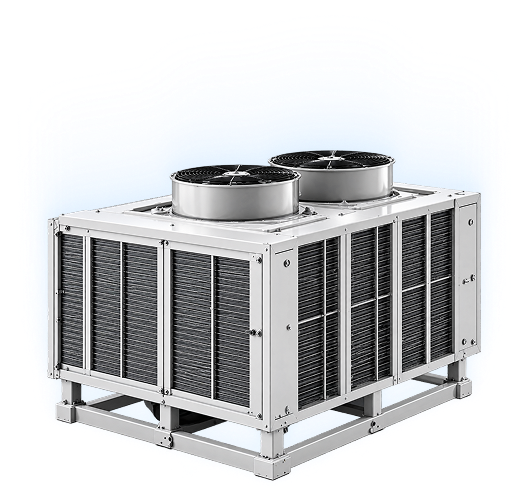
AHU-1● Healthy
Supply Temp12°C
Return Temp18°C
Fan Speed72%
StatusRunning
Manage work orders and keep your team on schedule.
Track utility costs with time-of-use data and identify savings.
Total Cost
$1,240 ↓ 18%
vs. previous period
Cost (USD) ▾PeakShoulderOff-Peak
Keep indoor environments healthy, comfortable, and compliant.
22°CIndoor Temp
CO₂620 ppm
Humidity45%
IAQGood
Maintenance Workflow
Otymize Turns Detected HVAC Faults Into Clear Maintenance Actions. Get The Right Information, Assign The Right People, And Resolve Issues Faster With Complete Visibility.
Get The Right Information, Assign The Right People Visibility.

Air Handling Unit | 50,000 CFM

Abnormal vibration levels detected on supply fan. Likely bearing wear. Immediate inspection recommended.
 Alert DetectedApr 23, 2024 | 08:14 AMDetected
 Technician AssignedApr 23, 2024 | 09:20 AM | Assigned to: M. AliIn Progress
 Bearing ReplacementScheduled for Apr 23, 2024 | 02:00 PMScheduled
Energy Intelligence
Track Energy Consumption, Peak Demand, And Uncover Savings Opportunities Across All Your HVAC Systems And Buildings.
320 kWh ↓ 12%
vs. previous period72 kWhPeak at 2:00 PM
Peak Load At 2 PMEnergy usage reached 72 kWh, driven by high cooling demand.
After Hours Usage DetectedUnusual energy consumption between 10 PM 4 AM
Potential Savings 18%Optimize HVAC schedules and setpoint strategies to reduce energy costs.
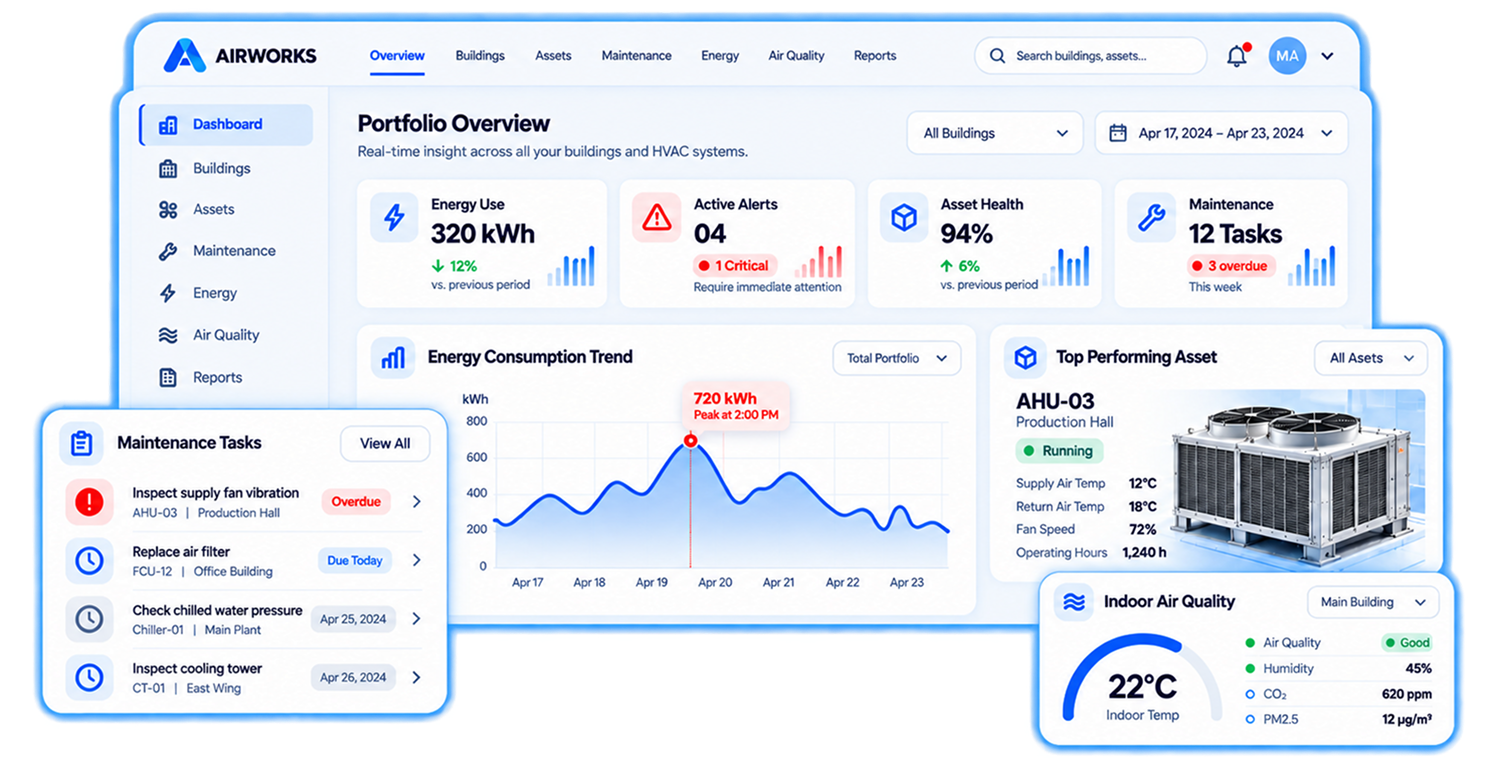
Building Overview
Bring HVAC Performance, Energy Usage, Asset Health, And Maintenance Activity Together In One Clear View.
| Issue | Asset | Priority | Status | Due Date |
|---|---|---|---|---|
| High supply fan vibrationExcessive vibration detected | AHU-03Production Hall | Critical | In Progress | Apr 23, 2024 |
| Replace air filterFilter pressure high | FCU-12Office Building | High | Open | Apr 24, 2024 |
| Check chilled water pressureLow pressure alert | Chiller-01Main Plant | Medium | Scheduled | Apr 25, 2024 |
| Inspect cooling towerRoutine maintenance | CT-01East Wing | Low | Open | Apr 26, 2024 |
Good12
Warning3
Critical1
Maintenance Management
Get Ahead Of Issues With Real-Time Alerts, Smart Work Orders, And Complete Maintenance Tracking. Reduce Downtime And Extend Equipment Life. Keep Your Buildings Healthy, Comfortable, And Compliant.
Monitor Temperature, Humidity, CO₂, And PM2.5 Across Every Space. Keep Your Buildings Healthy, Comfortable, And Compliant.
Indoor Air Quality
Monitor Temperature, Humidity, CO₂, And PM2.5 Across Every Space. Keep Your Buildings Healthy, Comfortable, And Compliant. Monitor Temperature, Humidity, CO₂, And PM2.5 Across Every.
Monitor Temperature, Humidity, CO₂, And PM2.5 Across Every Space. Keep Your Buildings Healthy, Comfortable, And Compliant.
PM2.512 µg/m³
CO₂620 ppm
Temperature22°C
Humidity45%
Get Started
Join Forward Thinking Organizations That Trust Otymize To Monitor, Manage, And Optimize Their Building Performance.